What is the PA index
This is a coefficient that shows what part of non-current assets, including fixed assets, is financed by the enterprise’s own capital.
Exceeding the KPA indicates an unstable financial position of the company, since:
- in the absence of long-term borrowed funds, this situation suggests that PAs are formed not only from their own, but also from external short-term sources, and withdrawing money from circulation for such purposes can lead to the inability to pay off short-term obligations;
- if there are long-term borrowed funds on the balance sheet, a CPA of more than 1 also signals possible financial problems in the event of money being withdrawn from circulation with the obligation to return it to creditors.
Permanent asset index – balance sheet formula
Since the IPA characterizes the degree of financing of the SAI using its own capital, the calculation includes indicators of both non-current assets and insurance capital. Optimal values will vary by industry and specific enterprise. On average, an indicator with a value of 0.5-0.8 is considered normal. When receiving deviations up or down, it is necessary to analyze the reasons for the insufficiency or, conversely, the excess of the involvement of the SC.
Constant asset ratio – balance sheet formula:
KPA = VOA / SK or KPA = page 1300 (form 1) / page 1100 (form 1).
The lower the obtained CPA value, the worse the financial stability of the business, since in this case the non-current assets of the enterprise are financed not from its own funds, but from external investment. When making calculations, it is recommended to additionally analyze the nature of lending - short-term or long-term, as well as an analysis of management policies.
In some situations, ineffective management of an organization can lead to unreasonable use of profits and, as a result, the lack of a sufficient amount of capital to provide permanent assets. Or, conversely, the company may abuse the investment of funds in non-current assets, which will subsequently lead to a lack of money for payments, purchases of raw materials, etc. As a result, there will be an urgent need to attract loans and borrowings; receiving a deferment on the creditor, which will generally negatively affect the solvency of the organization.
How to calculate
The permanent asset ratio is equal to the ratio of non-current assets to equity:
KPA = BOA/SC.
Permanent asset index (balance sheet formula) = line 1100 / line 1300.
The value of the indicator, of course, depends on the company’s field of activity. Thus, in capital-intensive industries its value will be higher than in enterprises, the availability of fixed assets in whose activities is not a decisive factor. For example, for trading enterprises, working capital will prevail in the balance sheet structure.
The generally accepted standard value of KPA is in the range from 0 to 1.
KPA is directly related to the agility coefficient, which, on the contrary, shows what part of the working capital is financed by the organization’s own capital.
The sum of these two indicators must equal one.
How to calculate a permanent asset index
This is a calculated value characterizing the level of VNA coverage due to the capabilities of the organization’s own capital.
The calculation of the index shows how solvent the institution is, financially stable and independent of loans and other raised funds and investments.
The calculated indicator is the ratio of non-current assets to the enterprise's equity capital. To calculate the permanent asset index, the formula for the balance sheet will be as follows:
IPA (KPA) = page 1100 of form 1 (VNA) / page 1300 (SK) of form 1.
The key factor in the performance of the index is the industry characteristics and specific characteristics of the functioning of each organization. The procedure for regulating equity capital is important. If the calculated index value varies between 0.5 and 0.8, this indicates that the company is financially stable and solvent.
If there is a deviation from normal indicators, either upward or downward, a conclusion is drawn about an inadequate or increased level of raising equity capital.
When analyzing an underestimated index, experts say that the organization is financially unstable, which means that the VNA is mostly covered by raised funds or additional investments.
If an increased index value is observed, one can also conclude that the enterprise is unstable - the relationship between own and borrowed funds is out of balance, the institution does not have long-term loans, however, permanent funds are also created through short-term external borrowings, so the withdrawal of finances to cover short-term funding sources can lead to a deficit of the company's entire budget.
Balance sheet liquidity: what is it and what is it for?
For any enterprise, the key points are its sustainability and solvency.
In order to determine how strong it is, it is necessary to analyze the balance sheet indicators and determine its liquidity.
Each organization has certain obligations to counterparties. The ability to pay obligations with one's own (assets) is called liquidity. Accordingly, the higher the liquidity ratio, the better. Low performance is a harbinger of bankruptcy.
The most liquid assets are money.
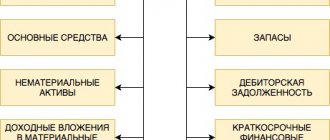
We present the classification of assets and liabilities by degree of liquidity in the table.
| ASSETS | PASSIVE | ||
| Asset code | Implementation time | Passive code | Maturity |
| A1 | The fastest selling assets | P1 | Fastest repayment period |
| A2 | Implemented at high speed | P2 | Repayable moderately |
| A3 | Implementation is slow | P3 | Repaid at a low rate |
| A4 | Such assets are difficult to sell | P4 | Permanent liabilities |
The fastest way to sell (or convert into money) cash is the hardest to work with non-current assets, which fall into group A4.
At the same time, accounts payable are easiest and fastest to repay, but the organization’s own liabilities are not repaid at all.
In this regard, the following criteria for balance sheet liquidity have been introduced:
- The most acceptable situation is when A1 is greater than P1. This means that the company can quickly and without any problems pay off urgent obligations
- The company can quickly pay off its debts. Moreover, A2 is greater than P2
- Loans that a company takes out for a long period of time, it can repay creditors using assets that are sold slowly. In this situation A3 is greater than P3
- In the case when the previous inequalities are satisfied, it automatically turns out that A4 is less than or equal to P4. This situation indicates that the company is reliable, it can quickly and without much difficulty pay off all its obligations.
| IMPORTANT! If the balance sheet indicators satisfy all the above conditions, then it is absolutely liquid |
Line 2421 “incl. permanent tax liabilities (assets)"
As a permanent tax liability, the amount of tax that leads to an increase in tax payments for income tax in the reporting period is taken into account, and under a permanent tax asset - the amount of tax that leads to a decrease in tax payments for income tax in the reporting period. The reason for the occurrence of permanent tax liabilities (assets) is the discrepancy between the amounts of certain types of income or expenses recognized in accounting and for profit tax purposes (clauses 4, 7 of PBU 18/02).
The amounts of permanent tax liabilities (assets) are accounted for in the debit (credit) of account 99 “Profits and losses” separately (Instructions for using the Chart of Accounts).
Accounting data used when filling out line 2421 “incl. permanent tax liabilities (assets)"
The value of the indicator of this line (for the reporting period) is defined as the difference between credit and debit turnover for the reporting period in account 99 (analytical account (sub-account) for accounting for permanent tax liabilities (assets)) and represents the balance of permanent tax assets and permanent tax liabilities accumulated during the reporting period.
A negative difference means that permanent tax liabilities are greater than permanent tax assets. And since permanent tax liabilities reduce net income, the difference is shown in parentheses on the Income Statement as a negative amount.
A positive difference means that permanent tax assets are greater than permanent tax liabilities. And since permanent tax assets increase net income, such a difference is shown in line 2421 without parentheses as a positive value.
Since permanent tax liabilities (assets) are included in the indicator of line 2410 “Current income tax”, when calculating net profit on the Statement of Financial Results, the indicator of line 2421 “incl. permanent tax liabilities (assets)” is not taken into account.
Line 2421 “incl. permanent tax liabilities (assets)” Statement of financial results = The difference between credit and debit turnover in account 99, analytical account for accounting for permanent tax liabilities and assets.
Line indicator 2421 “incl. permanent tax liabilities (assets)” (for the same reporting period of the previous year) is transferred from the Statement of Financial Results for this reporting period of the previous year.
An example of filling out line 2421 “incl. permanent tax liabilities (assets)"
Indicators for account 99 in terms of permanent tax liabilities and assets for the reporting period in accounting:
rub.
| Turnover for the reporting period (2014) | Sum |
| 1 | 2 |
| 1. By debit of account 99 in terms of permanent tax obligations | 366 403 |
| 2. On the credit of account 99 in terms of permanent tax assets | 1 092 000 |
Fragment of the Financial Results Report for 2013
| Explanations | Indicator name | Code | For 2013 | For 2012 |
| 1 | 2 | 3 | 4 | 5 |
| incl. permanent tax liabilities (assets) | 2421 | 1853 | 916 |
Solution
The difference between credit and debit turnover on account 99 is positive and amounts to 726 thousand rubles. (RUB 1,092,000 - RUB 366,403).
A fragment of the Income Statement in the example will look like this.
| Explanations | Indicator name | Code | For 2014 | For 2013 |
| 1 | 2 | 3 | 4 | 5 |
| incl. permanent tax liabilities (assets) | 2421 | 726 | 1853 |
Liquidity ratios based on balance sheet indicators
There are three ratios that determine the liquidity of the balance sheet.
The most common is the current ratio , which is determined by the ratio of current assets to the value of short-term liabilities. This ratio shows how much the organization is able to pay its current debts at the expense of current assets. Its value should fluctuate between 2-3.
Another significant ratio is the quick liquidity ratio. It is defined as the ratio of current assets with high liquidity to short-term liabilities. Its value should be higher than 1. The coefficient shows whether the company will be able to cover its current debts if there are difficulties with selling products.
The current ratio is less common than the previous two ratios. Its value must exceed 0.2. The indicator is calculated by dividing the amount of cash and short-term financial investments by current liabilities. The ratio shows how much debt an organization can pay off immediately.
All indicators are calculated based on balance sheet data.