Where to start assessing the financial performance of an organization
A significant block in the analysis of the financial condition of an enterprise is the assessment of the profitability of its activities. It is carried out to see:
- How adequate are the organization’s expenses given the current level of income;
- is the influence of net profit significant in the formation of equity capital;
- how effectively assets and liabilities are used in relation to profit;
- what factors hinder the growth of financial results.
In fact, in the named tasks we have summarized the stages of analysis. We will return to them later. Now we’ll tell you what questions you should ask at the beginning of your research. These will be:
- where can I get information?
- For what period should the calculations be made?
- how to formulate correct conclusions?
Where can I get information?
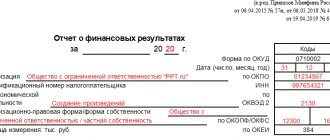
To analyze a company's financial performance, you will need an income statement and a balance sheet. The report will be the main one, since it contains four types of profit (loss). Only one line is allocated for this in the balance sheet.
For what period should the calculations be made?
If you take the annual financial statements, which are compiled according to the Russian format, then the analysis will cover a maximum of two years. For example, a five-year study would require reports for four consecutive annual periods.
How to formulate correct conclusions?
There is a misconception: financial analysis comes down, first of all, to calculating the mass of coefficients. And conclusions are secondary and normal when they are based on the principle “There was so much, there is so much.” In reality, it is better to calculate a limited set of indicators, but get into their essence and thoroughly understand what the values say. A bunch of meaningless numbers are a waste of an analyst’s time.
Sometimes the problem with understanding and drawing conclusions lies in the lack of general knowledge about how the financial result is considered and what it is. Let's remember the key points of these questions.
There is a misconception: financial analysis comes down to calculating a mass of ratios. And the conclusions are secondary. In reality, it is better to calculate a limited set of indicators, but get into their essence and thoroughly understand what the values say. A bunch of meaningless numbers are a waste of an analyst’s time.
How to calculate profitability based on net profit?
Indicators of economic efficiency of a business can be direct or inverse. The first are return coefficients: a conventional unit of result per conventional unit of cost to achieve it. The latter, on the contrary, start from a unit of result and demonstrate what volume of conditional costs is necessary to obtain it (capacity coefficients).
Profitability is considered one of the main characteristics of the efficiency of a company's economic activities. The influence of inflation on it is minimal; it can be expressed in the form of various ratios of income and expenses (but, as a rule, it is measured in coefficients).
Thus, profitability is an indicator of the efficiency of economic activity, characterizing how competently various resources (financial, material, human, etc.) are used.
There are two types of profitability indicators. In both cases, they are calculated as the ratio of one measure to another.
The main types of profitability for the business owner, investors, shareholders and other stakeholders are:
- Return on assets
This financial ratio reflects the profitability and performance of the company - the income that was received from each ruble of costs. Return on assets is calculated by dividing net profit by the average value of assets and multiplying the resulting result by 100%:
Return on assets = (Net profit : Average annual assets) x 100%
The initial data is taken from accounting documents: PE - from Form No. 2 entitled “Statement of Financial Results” (formerly called the “Profit and Loss Statement”), the arithmetic average of assets for the year – from Form No. 1 called “Balance Sheet”. If it is necessary to calculate the return on assets as accurately as possible, sum up the size of assets at the beginning and end of the year and divide this value in half.
Return on assets shows how much the actual profitability did not coincide with the expected one, and determines the reasons for this.
Using return on assets, you can compare the efficiency of enterprises operating in the same market niche.
Let’s say that in 2021 the company owned assets worth 2.698 million rubles, in 2021 – already 3.986 million rubles. Net profit in 2021 amounted to 1.983 million rubles.
Let's calculate the average annual value of assets by finding the arithmetic average between the amounts for both years. It is equal to 3.342 million rubles.
In 2021, return on assets was 49.7%.
Looking at these figures, we see that every ruble spent gave the company a profit of 49.7%. This is the profitability indicator.
- Profitability of fixed production assets (OPF)
This indicator, also called return on fixed assets, is calculated by dividing net income by the cost of fixed assets and multiplying the result by 100%:
Profitability of OPF = (PE: Average annual cost of fixed assets) x 100%
It shows what the real profitability is when using the fixed assets with which products are produced. All initial data for calculating the profitability of fixed production assets can be obtained from financial statements, namely: from forms No. 2 (net profit volume) and No. 1 (average size of fixed production assets).
Let's look at a practical example. In 2021, the company’s production assets were estimated at 1.056 million rubles, and a year later – already at 1.632 million rubles. In the same year 2021, the company showed a net profit of 1.983 million rubles.
Let's calculate the arithmetic average of the funds' values, it turns out to be 1.344 million rubles. Their profitability for 2021 will be 147.5% - this is the real profitability from using them.
- Return on sales
With return on sales, everything is simple: it reflects the share of profit in the company’s revenue. In fact, this is the profit ratio for every ruble earned. This indicator is expressed as a percentage and calculated for a certain period.
Sales profitability is the marker that a business leader first pays attention to. Based on data on sales profitability, companies change their pricing policies and optimize costs for selling goods.
Return on sales = (Profit : Revenue) x 100%
Each enterprise has its own unique profitability indicator. There cannot be generally accepted measures here, since both the range and competitive strategies of companies vary greatly.
You can calculate the return on sales ratio based on different types of profit. This gives rise to several variations of this indicator. It is most often calculated by gross or net profit, but operating return on sales is also common.
Return on sales by gross profit = (Gross profit : Revenue) x 100%
Return on sales based on gross profit is calculated by dividing gross profit by revenue and expressed as a percentage.
In turn, gross profit can be calculated by subtracting the cost of sales of a product from its revenue. This data is contained in form No. 2.
Let's look at a specific example. In 2021, the company received a gross profit of 2.112 million rubles, and its annual revenue was 4.019 million rubles. Return on sales, calculated based on gross profit, will be 52.6% - that is, every ruble earned by the company in 2021 consisted of 52.6% gross profit.
Operating return on sales = (Profit before tax : Revenue) x 100%
Operating return on sales is the ratio of profit (before taxes) to revenue. It also has a percentage expression. All initial information for the calculation is in form No. 2.
This indicator shows the share of profit in each ruble that the company earned, after taxation of revenue.
Let's assume that the company's profit in 2021, excluding taxes, amounted to 2.001 million rubles. The company earned only 4.019 million rubles in the same year. In this case, the operating return on sales will be 49.8%. This means that every ruble of money received, after the company has paid all mandatory taxes, contains 49.8% of profit.
Return on sales based on net profit = (Net profit : Revenue) x 100%
Return on sales based on net profit is the ratio of net profit to the amount of proceeds expressed as a percentage.
All initial indicators, as in other cases, are in form No. 2.
Let’s assume that the company received a net profit of 1.983 million rubles in 2021, having earned only 4.019 million rubles during this period.
If we calculate the return on sales based on net profit, it will be equal to 49.3%: every ruble earned by the company is 49.3% net profit.
In some cases, the return on sales ratio is referred to as the rate of profitability, since it reflects the share of profit of one type or another in the proceeds from the sale of products, provision of services or work.
When analyzing profitability of sales, keep in mind that its fall indicates a decrease in demand for the company's products and its competitiveness. In such cases, care must be taken to stimulate demand, develop new market niches, or improve the quality of the product (service) offered.
In factor analysis, profitability of sales is considered from the point of view of its influence on the price dynamics of cost and the final cost of goods (services, works).
To detect trends in changes in profitability, reporting and base periods are distinguished. The base year is usually taken to be the last year or the period when the company was at the peak of success and received the highest profits. Profitability ratios for both periods are compared.
Increasing profitability of sales can be achieved by increasing consumer prices for the product range or optimizing costs. When choosing a strategy of action and the corresponding communication, price, and product levers of influence on the situation, the following factors should be taken into account: fluctuations in demand, dynamics of market conditions, actions of competitors, and the possibility of reducing production costs.
We recommend
“Sales profitability formula: calculation example” Read more
How to calculate the financial result of an enterprise's activities
Here are some simple rules:
- The financial result of an enterprise is the difference between income and expenses. If it is positive, then the result is called profit. If it is negative, it is a loss. It turns out that identifying profit with income, and loss with expenses, is incorrect. These are fundamentally different indicators;
- financial results vary. Everything is determined by exactly what income and expenses you take into account. For example, if everything is at all, then you will get a net profit (loss). If only for the main types of activity, then profit (loss) from sales. Otherwise, it is called the operating result of activities;
- the previous two rules are not entirely suitable for calculating retained earnings or uncovered loss from the balance sheet. There it is no longer just income minus expenses. This is the amount of net profit (loss) that the enterprise has accumulated over the entire period of operation, taking into account adjustments for some operations. For example, a decrease due to the payment of dividends;
- In most cases, it is incorrect to equate income and expenses with cash inflows and outflows. This means that the financial result cannot be considered as the balance of money in accounts and in the cash register. Such equality is sometimes possible only for organizations that use the cash method of recognizing income and expenses. Who is allowed to use it is written in paragraphs 4 and 5 of Art. 6 of the Law “On Accounting”.
In the diagram we showed what the types of financial results are called in Russian reporting and how they are calculated.
Note:
OFR – financial results report; BB – balance sheet; the numbers in brackets are the line numbers of the financial statements
Drawing. Types of financial results in Russian reporting
It is important to understand: there are no hard and fast rules in financial analysis. This means that the analyst always chooses the calculation method and the set of both initial and final indicators himself.
Formation
The financial result is based on the profit or loss of the enterprise. Profit is the difference between the company's revenue or income from the production and sale of its products and the sum of all costs incurred. You should not equate the income of an enterprise with its profit, since income is the sum of all funds received by the enterprise as a result of the production and sale of products without taking into account costs. It depends, in turn, on the volume of products produced and the price of its sale. Thus, the higher the income received, the higher the net profit can be, and vice versa.
Obtaining maximum profit involves minimizing production costs. In the case when costs exceed the amount of funds received, the enterprise’s profit is negative and it suffers losses, which means it receives a negative financial result.
Profit goes through several stages of its formation:
- Fixed costs in the form of mandatory payments are subtracted from total revenue and net revenue is formed. Such payments may include VAT and excise taxes.
- The difference between net revenue and the cost of the product, equal to the cost of its production, is calculated. The resulting amount is called gross profit.
- From the resulting gross profit, operating costs such as advertising or management expenses are subtracted, and the result obtained is the profit from sales.
- Balance sheet profit is formed; for this, the balance of other income and expenses is subtracted from the profit received from sales.
- Taxation is subtracted from the balance sheet profit and the resulting result is the final net profit.
Thus, there are several types of profit, the formation of which occurs in stages. The financial result is most accurately displayed at the last stage.
Assessing financial results: stages and indicators
It is important to understand: there are no hard and fast rules in financial analysis. This means that the analyst always chooses the calculation method and the set of both initial and final indicators himself. Therefore, our approach is approximate. In it, we focused primarily on Russian reporting. It does not have ready-made indicators of marginal profit, EBITDA, NOPAT, etc. They will not be in our stages and examples.
We offer step-by-step instructions on how to make a financial analysis of an enterprise in terms of financial results.
Stage 1. Conduct a horizontal analysis of profit (loss)
The essence of horizontal analysis is to understand how the financial result has changed compared to the previous period. Here are some of its features:
- you will need at least two profit (loss) values. One of them is taken as the basis for comparison. Typically this is a value from the earliest time period;
- either absolute or relative deviations of the actual level from the base level are calculated. To calculate the latter, formulas for growth rates and increments are useful. See them in table 1;
- absolute deviations are measured in the same unit as the analyzed indicator. In our case it will be rubles. Relative – either as a percentage or as a share;
- if the indicator in the base period was zero or had a different sign than in the current one, then the growth/increase rates will either not be calculated or they will not make sense. For example: in 2021 the organization received 1 million rubles. loss, and in 2021 – 2 million rubles. arrived. The growth rate is: 2 ÷ (-1) × 100% – 100% = -300%. If interpreted literally, it will turn out like this: the financial result for the year decreased by 300%. Agree, this is stupidity;
- the nature of the change (positive, negative) does not depend on the sign of the resulting deviation. It is determined by the meaning of the indicator itself. For example, growth and, therefore, positive deviations are important for income or profit. For expenses and losses, on the contrary, they are negative.
Table 1.
Deviation formulas for horizontal analysis
| Indicator name | Formula | |
| Absolute deviation | N1–N0 | |
| Relative deviations | Growth rate | N1 ÷ N0 × 100% |
| Rate of increase | (N1 – N0) ÷ N0 × 100% | |
| Note: N0, N1 – values of the analyzed indicator in the base and current periods | ||
Stage 2. Perform a vertical analysis of the financial results of the enterprise
Vertical analysis consists of calculating the specific weight of any indicator in the total sum of homogeneous values. Otherwise, it is an assessment of the structure in which a separate element is correlated with a certain whole of which it is a part.
This approach has a unique feature for all indicators from the financial results statement, since it is not immediately clear what is considered the whole into which the partial values will be divided. Reason: the report is based on the principle of subtraction, not summation, unlike the balance sheet.
Therefore, we propose to implement vertical analysis in two directions:
- for retained earnings from the balance sheet, calculate its share in equity and/or liabilities. This will make it possible to understand how significant the contribution of the accumulated result is to the total amount of sources of financing the enterprise’s activities;
- for other types of profit from the income statement, correlate their value with income. Moreover, for gross profit and sales, calculate the ratio with revenue. For profit before tax and net – with the amount of revenue and other income. Rationale: this way we will make a comparison with those incomes that took part in the calculation of a specific type of financial result. What will these calculations show? What amount of earned income remains with the enterprise at each stage of profit formation. Indirectly, this is a characteristic of the significance of the expenditure part, because the lower the share, the more expenses there are for each ruble of income.
It is important to remember: vertical analysis is meaningless for loss indicators.
Here is the formula for calculating specific gravity:
Ni = ∑Ni × 100%,
where Ni is the value of a specific indicator (part);
∑Ni is the value of the general indicator, which includes Ni as a component element (whole).
Absolute values of financial results have a big drawback: a low degree of comparability with other organizations. This is true even if the financial statements of enterprises of the same type of activity are examined.
Stage 3. Calculate profitability indicators
Absolute values of financial results have a big drawback: a low degree of comparability with other organizations. This is true even if the financial statements of enterprises of the same type of activity are examined. For example, a federal retail chain’s ruble profit will easily be many times higher than that of a local store. However, its ratio to the value of assets, equity or revenue may show a different picture - not at all in favor of the trading giant.
Such relationships between the values of the financial result and other indicators of the organization’s activities are called profitability. Their undoubted advantage is the opportunity to compare initially disparate absolute values.
Here are a few features that are characteristic of such relative quantities:
- There is a basic calculation scheme. Its essence: the numerator is always profit, the denominator is the indicator whose profitability is calculated. Most often these are: assets, equity and revenue. But nothing prevents us from putting only non-current or current assets, liabilities or borrowed funds into the denominator. The specific names of the indicators are determined by the denominator. For example, return on assets, equity, sales, etc.;
- What kind of profit should be used in the numerator? Decide for yourself. More often than others, net and from sales are used;
- if the denominator of the formula contains a balance sheet indicator, then its average annual value is taken, and not just the value as of the date. Why? Because the profit from the numerator is the financial result that is obtained for the period. It is incorrect to combine periodic and point values when calculating. A reasonable solution: turn what happened on the date into what was on average for the year. Not the most accurate, but the easiest way to do this is to sum up the halves of the values at the beginning and at the end of the year. Remember: in the balance sheet, all data is presented at the end of the period, for example, as of December 31, 2019. They can be regarded as the value at the beginning of the next year, that is, as of January 1, 2020;
- How is profitability measured? Standard practice is percentages. Less often – fractions of units. And very rarely, but also acceptable - rubles for rubles. For example, for return on assets, calculated based on net profit and equal to 10%, the interpretation will be as follows: for every ruble invested in assets, there is a return in the form of 10 kopecks of net profit;
- It is incorrect to call profitability those indicators whose numerator is a loss. More correctly – unprofitability. In this case there will be no contradiction with the original meaning of the word “rent”.
See Table 2 for the formulas for the main profitability indicators. In the following example we will use just such a set.
Table 2.
Relative indicators for assessing financial results
| Index | Formula | |
| by net profit | by sales profit | |
| Return on assets | Emergency ÷ Asr. × 100% | PP ÷ Asr. × 100% |
| Return on equity | Emergency ÷ SKsr. × 100% | PP ÷ SKav. × 100% |
| Return on debt capital | Emergency ÷ ZKsr. × 100% | PP ÷ ZKsr. × 100% |
| Return on sales | PE ÷ V × 100% | PP ÷ V × 100% |
Note:
| ||
Stage 4. Assess the impact of individual factors on the financial result
Factor analysis of financial results can be implemented in two directions:
- by absolute values of profit (loss);
- by relative values, that is, by profitability.
Let's look at the formulas for each of them.
Suppose: the analyst has nothing at his disposal except the financial statements of the enterprise. He does not have data on price, sales volume and operating profit for a specific product item. Then the following factor analysis formula will be optimal:
PP = B – SP – KR – UR,
where SP is the cost of sales (2120 OFR);
KR – commercial expenses (2210 OFR);
UR – administrative expenses (2220 OFR).
With its help, the influence of four factors (in the formula on the right) on the value of the financial result is assessed.
The peculiarity of the formula: to calculate the factor influence using it, there is no need to use any special techniques. When factors are linked through an algebraic sum, it is enough to calculate the absolute deviation of each to understand what its impact on the financial result was.
There are many models for factor analysis of profitability. Let's focus on the most popular - the DuPont model. Here is its three-factor formula:
Rsk = Rp × Koa × MK,
where Rsk is return on equity;
Рп – profitability of sales;
Koa – asset turnover ratio (B ÷ Asr.);
MK – equity multiplier (Avr. ÷ SKr.).
To assess the impact of three factors on return on equity, we apply the absolute difference method. Table 3 contains ready-made formulas for this DuPont model.
Table 3.
How to calculate the influence of factors in the DuPont three-factor model
| Factor | Formula for assessing its influence |
| Return on sales | ∆Рс (Рп) = ∆Рп × Koa 0 × MK 0 |
| Asset turnover ratio | ∆Rsk (Koa) = Rp 1 × ∆Koa × MK 0 |
| Equity multiplier | ∆Рsk (MK) = Рп 1 × Koa 1 × ∆МК |
Note:
| |
If everything is calculated correctly, then the absolute change in Rsk and the total impact of factors will be equal:
Rsk = ∆Rsk (Pp) + ∆Rsk (Koa) + ∆Rsk (MK).
General characteristics of analysis and assessment
Analysis of the financial results of an enterprise and organization involves studying both the final result of the enterprise’s activities and the process of obtaining it. The end result, of course, is profit, as the main indicator that a commercial enterprise focuses on. Of course, in conditions of market development, this is not always the case, because organizations often focus not so much on generating immediate profits, but on increasing the value of their own securities. This approach is called value-based management. However, transparent market conditions in Russia have not yet been formed, so now the analysis of the financial results of enterprises and organizations still implies an assessment of the company’s ability to make a profit .
Related materials
- Equity Analysis
- Credit analysis
For an external analyst, the main source of information for conducting this type of analysis is income statement , balance sheet , and cash flow statement . The financial results report is of interest primarily because it displays the main income, expenses and various financial results of the company. A balance is necessary when calculating individual profitability indicators, which will allow us to understand the effectiveness of using available limited resources (assets) for the purpose of generating profits.
The balance sheet also allows you to understand a little better the current sales policy of the enterprise. As for the cash flow statement , comparing its data with the financial results statement will allow you to understand the quality of the organization's sales and credit policies. It is worth noting that if an analysis is carried out not of an individual enterprise, but of an entire group of enterprises, then it is necessary to use consolidated statements, since the profits of one organization within the group can flow into the profits of another organization.
The purpose of analyzing financial results is to determine how effective it is to invest in an enterprise. Higher profitability ratios compared to competitors will indicate the attractiveness of such an investment alternative.
In the process of assessing financial results, the following should be determined:
1. What is the quality of earnings?
2. How successfully did the company generate profits during previous periods ?
3. Is the company able to continue to create decent financial results in the future ?
The quality of profit is determined using the income statement, information on the quality of accounts receivable, and the cash flow statement. If the share of problem receivables is high, this means that the company sold some of its products or services on unfavorable terms. This indicates high competition and low market power of the enterprise. In addition, if in the cash flow statement the amount from the sale of goods and services is significantly lower than the amount of revenue, then this confirms this conclusion.
Thus, the company sells goods and services without receiving payment at the time of delivery. If because of this the company does not receive money for them, then we can talk about low quality profits. The company, following accounting rules, will display the profit received in the income statement, but it is quite possible that in the future period the financial result will be negative due to the write-off of significant amounts of bad receivables.
When they talk about the quality of profit, they mean:
- How stable is such profit? Is there a high probability that the profit in the next period will be the same or higher;
- How adequate is the profit? Are accounting methods used that inflate current profit figures?
During the analysis process, you should also pay attention to the factors that shape financial results:
- competitiveness of products and services, which is expressed in the ability to maintain a high price for a product. An indicator for these purposes can be gross margin;
- level of production and efficiency of use of available material, labor and other resources;
- capital structure , which leads to a certain level of financial expenses;
- efficiency of tax liability management;
- quality of management and management skills.
Analysis of the financial results of an enterprise using a specific example
Let us show with an example how to analyze the financial and economic activities of an enterprise in terms of financial results. We outlined the stages above. In accordance with them, we will make calculations and write conclusions. Let's take the annual reports of Aeroflot PJSC for 2018 as a basis.
Stage 1
The table below shows all four types of profit from the income statement. We did not add retained earnings from the balance sheet to them. Reason: it is shown as a date. Therefore, we will not generalize interval and point indicators.
Table 4. Horizontal analysis of financial results
| Indicator, billion rubles. | 2017 | 2018 | Growth rate, % |
| 1 | 2 | 3 | 4 (3 ÷ 2 × 100 – 100) |
| Gross profit (2100 OFR) | 46,4 | 5,0 | -89,2 |
| Loss on sales (2200 OFR) | -1,5 | -38,6 | 2418,5 |
| Profit before tax (2300 OFR) | 35,2 | 4,1 | -88,4 |
| Net profit (2400 OFR) | 28,4 | 2,8 | -90,2 |
The most important financial results presented are the second and fourth. Profit (loss) from sales is an indicator of the effectiveness of the main business. Net – the final characteristic of the ratio of all income and expenses. Therefore, in our conclusions we will focus on them.
For PJSC Aeroflot, 2021 was unfavorable from the point of view of its key activity - air passenger transport. In 2021, the situation has completely become catastrophic. Reason: loss from operating activities.
Further, in the course of factor analysis, we will understand why this is so. In the meantime, let’s find the answer: how the company ultimately managed to gain profit. It is clear that these are some other transactions that have formed a positive balance of other income and expenses. Which ones exactly? The answer is given in the notes to the balance sheet and income statement. It follows from it that the largest share in 2021 belonged to other income from:
- missed passengers due to their failure to show up for the flight – 15.5%;
- profits of previous years, which were revealed in the reporting year - 10.3%;
- refund of excise tax on fuel – 10.1%;
- operations with fixed assets and other assets – 8.5%;
- fines and penalties for violation of contract terms – 8.3%.
Please note: everything, with the exception of the excise tax refund, is some random factor. They may not recur in the future at all or may recur to a much smaller extent. And then other operations will cease to be life-saving in bringing the company to a net profit.
In any case, the current situation is abnormal. Loss from sales is one of the most alarming calls in any business.
Loss from sales is one of the most alarming calls in any business.
Stage 2
We will divide the vertical analysis into two parts. Let's create separate tables for financial results from the balance sheet and the “second” form.
Table 5
. Vertical analysis of financial results on the balance sheet
| Index | 31.12.2016 | 31.12.2017 | 31.12.2018 | |||
| billion rubles | beat weight, % | billion rubles | beat weight, % | billion rubles | beat weight, % | |
| Share in equity | ||||||
| Retained earnings (1370 BB) | 68,2 | 97,9 | 77,3 | 98,2 | 65,8 | 109,3 |
| Capital and reserves (1300 BB) | 69,7 | 100,0 | 78,7 | 100,0 | 60,3 | 100,0 |
| Share in liabilities | ||||||
| Retained earnings (1370 BB) | 68,2 | 38,3 | 77,3 | 41,9 | 65,8 | 38,4 |
| Total passive (1700 BB) | 178,4 | 100,0 | 184,5 | 100,0 | 171,7 | 100,0 |
From the point of view of vertical analysis of retained earnings, the situation at PJSC Aeroflot is quite optimistic. Own capital consists almost entirely of it, and in the balance sheet currency its share is more than 1/3. This is a good “cushion” of financial security and stability. However, with a systematic net loss, it runs the risk of quickly melting away.
Let us especially explain the value of the share in capital and reserves as of December 31, 2018. It is above 100% and this is not an error. The reason is as follows: as of this date, the company had its own shares purchased from shareholders. Their acquisition price is entered in section III of the balance sheet with a minus sign. Because of this subtraction, the composite component may be larger than the final value, as in this case.
Table 6.
Vertical analysis of financial results according to the “second” form
| Index | 2017 | 2018 | ||
| billion rubles | beat weight, % | billion rubles | beat weight, % | |
| Share in revenue | ||||
| Gross profit (2100 OFR) | 46,4 | 10,4 | 5,0 | 1,0 |
| Loss on sales (2200 OFR) | -1,5 | × | -38,6 | × |
| Revenue (2110 OFR) | 446,6 | 100,0 | 504,7 | 100,0 |
| Share in total income | ||||
| Profit before tax (2300 OFR) | 35,2 | 6,9 | 4,1 | 0,7 |
| Net profit (2400 OFR) | 28,4 | 5,6 | 2,8 | 0,5 |
| Total income (2110 OFR + 2310 OFR + 2320 OFR + 2340 OFR) | 507,4 | 100,0 | 573,4 | 100,0 |
For every ruble of revenue in 2021 there was only 10 kopecks of gross profit. And in 2021 - only 1 kopeck. This means that the cost of sales at PJSC Aeroflot is very significant in relation to the main income. Moreover, in 2021 there was a significant increase of 24.8%. Explanations for reporting disclose why. The most important reasons:
- an increase in material costs by 42.0%, including costs for aviation fuels and lubricants - by 49.0%;
- increase in leasing payments by 19.7%;
- an increase in costs for code-sharing operations (joint operation of overhead lines) by 18.9%.
Against the background of revenue growth of only 13%, such dynamics in the area of expenses is extremely negative. As noted above, the situation can only be saved by a positive balance of other income and expenses. This means that the profitability situation at PJSC Aeroflot is very unstable.
The share of profit before tax and net profit in the company's total income is also small. Moreover, in 2021, negative dynamics are clearly expressed. Of the earned 573 billion rubles. Income from net profit accounts for only 0.5 kopecks from each ruble. It is obvious that with such a size and dynamics of income, the company’s expenses require significant optimization.
Note: we did not calculate the share of profit from sales. There is no point in finding the fraction of a negative number in a positive one.
Stage 3
Let's evaluate the financial results of PJSC Aeroflot through relative profitability indicators. We will make calculations based on net profit.
Table 7.
Values and dynamics of profitability
| Index, % | 2017 | 2018 | Growth rate, % |
| Return on assets | 15,7 | 1,6 | -90,0 |
| Return on equity | 38,3 | 4,0 | -89,5 |
| Return on debt capital | 26,5 | 2,6 | -90,3 |
| Return on sales | 6,4 | 0,6 | -91,3 |
Profitability by all indicators in 2021 was only about 10% of the previous year. An average reduction of 90% is a catastrophic situation. Here its main reason is an almost tenfold drop in net profit. It turns out: every ruble of assets, capital and revenue in 2021 was given to the business 10 times less than in 2021.
However, even such a negative scenario is not the worst. If we calculated profitability based on the operating financial result, we would get completely negative values. Let us remind you: in this case, this is no longer profitability, but unprofitability.
How to determine financial results in accounting
The calculation involves sales accounts (90), other income and expenses (91). The accountant makes monthly calculations of the total values, summarizing the turnover on these accounts and transferring them to the effective profit and loss account - 99.
Account 90 is used to account for the results obtained from the main activities of the company. All transactions are generated on it according to certain subaccounts. Revenue is accumulated on the account loan. 90/01. This amount is reduced by generalized costs:
- Cost of products sold (account 90/02);
- Sales costs (account 90.07);
- Management expenses (90.08);
- VAT/excise taxes (90.03);
- Customs duties if the company carries out export operations (90.05).
The calculation results are displayed on subaccount 90.09. When closing a monthly period, the amount is offset from the account. 99, and at the end of the year the entire account is reset to zero.
Accounting for the results obtained by the company from other activities is carried out on the account. 91. Such income is accumulated according to K-that account. 91/01. For example, these could be:
- Receipts from leased property;
- Interest received on deposits placed in banks;
- Fines received into the company’s accounts, paid by partners for various types of obligations, etc.
According to D-that account. 91/02 records other non-production costs: fines, penalties, taxes assessed by regulatory authorities, amounts of penalties paid to counterparties and other costs.
At the end of the month, the result from the listed operations is calculated and displayed on the subaccount 91/09, and then corresponds with the account. 99 count. At the end of the year the account is closed.
On the account 99 net profit is calculated as the final result for all types of activities for the year. According to K/t accounts reflect the profit, according to D/t – the total loss. In addition, account 99 is used to reflect extraordinary income and expenses, as well as sanctions from tax authorities and income tax.
Summarized data is generated monthly on the account. 99. By comparing its turnover, the amount of profit or loss, i.e., financial result, is calculated. The credit balance reflects the amount of profit, and the debit balance reflects the loss. At the end of the year, the calculated balance on the account. 99 goes to the retained earnings account - 84, and all indicated accounts (90,91,99) are closed. This operation is called balance reformation.
The main accounting entries will be as follows: