What is it and where can I see it?
At the end of the reporting period, management needs comprehensive information about the return on assets and profitability of the enterprise. Accordingly, it is necessary to know the amount of revenue and expenses. For this purpose, a balance sheet is prepared.
The balance sheet is not only information for reporting to the Federal Tax Service, it is a source of data for analyzing the current activities of the enterprise and making forecasts. This is a document showing the financial position of an enterprise at the reporting date, the value of assets and the amount of capital of the organization, as well as the amount of its liabilities.
As for revenue, there is no separate line for it in the balance sheet. This, surprising at first glance, circumstance is explained by the fact that the assets and liabilities of the enterprise are reflected in the balance sheet at the moment in question. Whereas the sold product or service is no longer an asset. And the financial results, which include revenue, are reflected in the income statement.
Sometimes it is still possible to define a line item for revenue on the balance sheet. This is a case where the finished products sold were not paid for. Revenue from the sale of finished products is usually represented by the following entry: Debit of account 62 “Settlements with buyers and customers” – Credit of account 90 “Sales”, subaccount “Revenue”. Read about which accounting account revenue can be displayed in here.
Thus, customer debt equal to revenue from the sale of goods and services of the enterprise will be reflected in line 1230 “Accounts receivable”.
Attention! Balance sheet revenue in line 1230 is indicated including VAT, and in the profit and loss statement net revenue is indicated - this is the amount reduced by the VAT charged on revenue.
Meaning and Analysis of Balance Sheet Profit
Key indicators and a full analysis of financial results are of paramount importance for all actual and potential investors. Specific calculations, comparison with the results of work over past periods, as well as analysis of the work of similar workshops and divisions of other enterprises make it possible to outline prospects for further growth, find errors and ways to correct them.
Ultimately, this will directly affect the assessment of the business qualities of the management of each business entity and the qualifications of its personnel. A thorough step-by-step analysis allows us to identify the main reasons for the decline in profits, for example:
- insufficient sales growth and price declines;
- consumption of excess resources and increased prices for them;
- ineffective work of individual departments or groups of managers and specialists;
- a general decline in buyer interest in certain groups of goods.
A general indicator of balance sheet profit and a detailed calculation of all its components gives a clear idea of the level of efficiency of the organization, as well as its business processes in various sectors of activity of a single enterprise and the workforce as a whole.
Calculation formula
The development strategy of any enterprise is based on data on sales prices and production scales. These categories are determined based on the experience of previous periods, taking into account all external factors. And revenue is a general indicator that gives an idea of the dynamics of the organization’s development.
Revenue is the sum of all funds received by the enterprise during the period under study from the sale of goods, services, and property rights. It can be expressed both in cash and in kind and calculated without taking into account value added tax and excise taxes (we talked about what is considered sales revenue in more detail here).
It is this indicator that is taken as the main one when calculating income and profit from core activities. It excludes expenses and amounts received from activities not related to the sale of goods and services.
The calculation algorithm is quite simple. Sales volume and unit cost information are required. If the price changes during the reporting period, it is necessary to calculate revenue taking into account each change.
Revenue is calculated taking into account the volume of sales completed and the cost in effect at the moment. Discounts, VAT, excise taxes and export tariff charges are not taken into account.
Today, there are two methods by which revenue is calculated:
- Cash (based on actual sales volume).
- Accrued (based on the fact of receipt of income, regardless of whether payment has already been received or not).
Cash is used for internal assessment of the enterprise’s activities and is not reflected in the reporting.
The calculation method is as follows: TR = Res.p (n) + GP - Res.p (k) , where:
- Res.p (n) and Res.p (k) – balances of finished products at the beginning and end of the reporting period.
- GP – finished products that are planned to be sold.
All calculations are expressed in monetary terms.
This indicator is calculated, as a rule, based on the results of the period, once a quarter and annually. The price and volume of products sold are internal information and are not reflected in the financial statements.
We provide more details about the formulas used to calculate revenue in a special article.
Sales profit - formula
How to calculate the value can be seen from the lines of Form 2 “Report on Financial Results”. Profit from sales is indicated on line 2200, broken down for the current year and the previous one. The formula looks like this:
Profit from sales (line 2200) = Gross profit (line 2100) – Selling expenses (line 2210) – Administrative expenses (line 2220).
Gross profit (line 2100) = Revenue (line 2110) – Selling cost (line 2120).
Note! When determining revenue, the values of VAT and excise taxes are not taken into account, since these taxes are reimbursable. To fill out Form 2, information is taken from the enterprise’s accounting data for the reporting financial period
Usually this is a year, but if necessary, you can analyze indicators over time and for another time period - a month, half a year, quarter, 9 months. etc. What accounts will be needed? First of all, this is the account. 90 and 91. To clarify the information, data from corresponding accounts are analyzed - 62, 68, 44, 26, 23, 20, etc.
To fill out Form 2, information is taken from the enterprise’s accounting data for the reporting financial period. Usually this is a year, but if necessary, you can analyze indicators over time and for another time period - a month, half a year, quarter, 9 months. etc. What accounts will be needed? First of all, this is the account. 90 and 91. To clarify the information, the data of the corresponding accounts is analyzed - 62, 68, 44, 26, 23, 20, etc.
To accurately determine the required profit values, the main thing is to clearly understand which indicator needs to be calculated. To analyze the performance of the entire organization, a general calculation is performed, and to assess the success of individual divisions or activities, the data is broken down according to the required criteria.
How is profit reflected in the balance sheet? More on this later.
Reflection of the indicator in section 1
Despite the fact that the balance sheet does not have a special line for accounting for revenue , it nevertheless contains a number of indicators, the consideration of which gives an idea of it.
The first section of the balance sheet is almost entirely, in one way or another, related to revenue.
For example, if there is a decrease in the residual value of intangible assets or fixed assets at the end of the reporting period (year), then most likely there was a sale of some objects. And as a result, the company gained revenue.
If investments in material assets are reflected in the balance sheet, then this predicts the emergence of revenue from the enterprise in the future , possibly as an additional type of activity.
In the column on financial investments, you can also track the company’s revenue. The management of a stable and profitable enterprise is always interested in further development and expansion. And to increase capital, financial investments are often used, which are secured precisely by the company’s profit, generated from revenue.
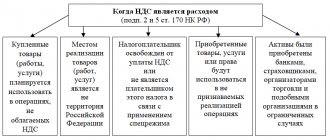
Components of balance sheet profit
The main items of balance sheet profit are profits or losses from:
- Sales of manufactured products.
- Actions aimed at generating profit other than the main activity.
- Secondary implementation actions.
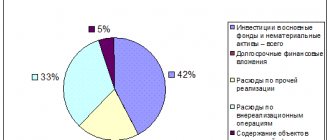
Of the listed items, the main one is the sale of manufactured products, since this item accounts for from 65% to 88% of the organization’s main profit.
It is formed throughout the entire period of activity. In an example it looks like this:
- The company is a manufacturer of a certain category of goods, their sale is considered gross (main) income. The final balance calculation amount will be the difference between the selling price (cost) and the purchase price (store price).
- Secondary actions for the sale and receipt of profit are considered to be actions for the sale of tangible property owned by the enterprise. These actions also include the sale of parts of the leading fund, various materials, fuel and raw materials. Sales of products, as mentioned above, are the main type of income. In addition to it and the secondary one, there is a 3rd type that forms balance sheet profit.
- Non-realization actions or actions different from the main ones. Their profit comes from incoming income from renting out their own premises, investments in other enterprises, and foreign exchange differences. In case of legal proceedings, fines, penalties, and penalties are also considered non-sales income.
Reflection of the indicator in section 3
The third part of the balance sheet reflects information about the company's revenues. When preparing the income and expense report, the amount of net profit goes to retained earnings and after that is reflected in the balance sheet, in the third section.
You can trace the connection to revenue in another way. So, for example, in order to create reserve capital and increase it, an enterprise needs to make a profit , which is impossible without revenue.
There are cases when the revenue indicator of an enterprise is very low, and in terms of other characteristics of the main activity the enterprise is even unprofitable. But the profit can be high.
This situation may arise, for example, in the case of an enterprise fulfilling a socially significant, but unprofitable, from a profit point of view, order. Accordingly, in this case, the source of profit is other income of the enterprise.
From our separate publications you can learn about how revenue differs from turnover, cost and other concepts, as well as what gross revenue is.
Concept concept
Profit before tax is a measure of a company's profitability that takes into account profits earned before any taxes are paid. It compares all of a company's expenses with its income, but excludes the payment of income taxes.
The indicator combines the company's entire profit before tax, including operating, non-operating income and expenses. This value exists because tax expenses are constantly changing, and eliminating them helps an investor gain insight into changes in a company's earnings or revenue from year to year. The term is interchangeable with the concept of “income before taxes” or “profit before taxes”.
This indicator is indicated in the company's financial performance report. Profit before taxes characterizes the business indicator that is the result of the company's reporting.
Taxable income is especially important because it is the basis for a company's tax payments, as well as tax expenses under applicable law.
Relationship with current assets
All information on current assets is reflected in the second section of the balance sheet. And an indicator of the company’s revenue can be the amounts that have been received by the company’s cash desk or into its current account. These amounts are reflected in the line “Cash and equivalents” of the second section of the balance sheet and, in fact, are the organization’s revenue.
The cash balance makes it possible to analyze the success of cash flow management at the enterprise. If large sums of money are reflected in the balance sheet, then it is possible that the company’s activities bring high profits, and managers do not have time to put them into circulation.
If the balances are low, then there may be a competent distribution of funds received from the sale of goods or services. That is, management acquires assets in a timely manner and makes financial investments, efficiently managing the finances of the enterprise.
But in this case, it is necessary to pay attention to the profitability of the enterprise, because small amounts of balances on the balance sheet may indicate a shortage of the company’s own funds.
Important! An important point is whether the proceeds go to the company’s cash desk or to a current account. Since upon receipt at the cash desk, it is possible to exceed the established limit, which is an administrative offense (Article 15.1 of the Administrative Code).
More information about the procedure for recording revenue when it is received at the cash desk or into an account can be found here.
The procedure for calculating this limit is determined by the instruction dated March 11. 2014 No. 3210-U.
Distribution and increase
The distribution and increase in balance sheet profit characterizes its profitability. The entire analysis of studying the positive economic growth of an organization is aimed at determining financial efficiency. Profitability calculation determines whether a company is using its resources effectively depending on its field of activity.
Profitability assessment is an effective tool in calculating the profitability of products, industries and various assets.
For each type of income there is a profitability formula. The data obtained on the basis of these formulas is needed to draw up the direction of the company’s development, its effectiveness or identify weaknesses in the production and sale of products.
Such calculations are divided into types that are based on spending policies, volumes of resources and specializations of profit. All data is taken on the basis of accounting reports, pricing policies and product costs, gross income and various financial expenses associated with the activities of the enterprise.
Calculation of the profitability of the main activity is responsible for the cost part and actions responsible for the sale of manufactured goods. Calculations are carried out to assess the liquidity of one ruble spent for the sale of goods. Also, the difference between the income from the sale and the total amount of its cost, which includes items of commercial expense, services sold and costs for administrative needs, is determined.
The resulting result from the calculations allows the company to autonomously cover the costs of the income component.
Calculating the profitability of a current asset determines the income received from all assets contributed to them, and determines whether they are being used effectively.
Both the components of net profit and its balance after tax plus asset turnover are determined. The results of calculations using this formula show the company’s ability to provide the required amount of profit in relation to the working capital used.
If this value increases, it means that working capital is used in a positive direction.
Return on sales is calculated using a coefficient that denotes net profit. The result of the calculation shows the financial result of the activity in general, which may depend on 2 lines of the income profitability indicator: profitability of sales of gross output and operating profitability in terms of the amount in net profit.
Calculation of cost profitability determines whether the funds spent on the production of goods are recouped. The result shows an assessment of the effectiveness of invested funds on costs.
What wiring is used?
Posting - the method of reflecting the profit received can be varied. There are two main options in modern economics. Firstly, the reflection of income at the time of shipment to the counterparty, and secondly, at the time of receipt of payment for the product/service from the counterparty.
Obviously, each posting has its own characteristics and they relate not only to the choice of account to be reflected. From an economic point of view, posting at the time of transfer of goods to the counterparty is considered more risky. If after this no settlement occurs, then the profit goes into debit debt - a debt that must be paid by the counterparty to the supplier.
As with any debts, one unpleasant thing can happen to accounts receivable - delays. Therefore, it is possible that the profit already reflected in the balance sheet will not be received in a timely manner. Another thing is the reflection of the funds actually received, everything is simpler here, because the accountant takes into account the money already received into the company’s account, the risks are minimal. Now let's talk about posting accounts:
| Operation | Debit. check | Credit. check |
| Received money for goods | 51 | 62.02 |
| Revenue from product sales is taken into account | 76 | 68 |
| Advance payment credited | 62.02 | 62.01 |
| Write-off of goods sold at sales price | 90.02.2 | 41.11 |
| Markup on goods sold | 90.02.2 | 42.01 |
Tags: asset, balance sheet, accountant, capital, ratio, credit, tax, expense, reserve, write-off, formula
Average monthly revenue
Average monthly revenue (K1) is calculated as the ratio of the revenue received by the organization during the reporting period to the number of months in the reporting period.
Average monthly revenue is calculated based on gross revenue, including sales revenue for the reporting period (payment), VAT, excise taxes and other mandatory payments.
Average monthly revenue, considered in comparison with similar indicators of other organizations, characterizes the scale of the organization's business.
Average monthly revenue is calculated based on gross revenue, which includes the organization’s sales revenue for the reporting period (for payment), VAT, excise taxes and other mandatory payments. It characterizes the volume of income of the organization for the period under review and determines the main financial resource of the organization, which is used to carry out business activities, including to fulfill obligations to the fiscal system of the state, other organizations, and its employees. Average monthly revenue, considered in comparison with similar indicators of other organizations, characterizes the scale of the organization's business.
The efficiency of non-working capital - capital productivity (K20) is defined as the ratio of average monthly revenue to the cost of non-working capital. The indicator characterizes the efficiency of use of fixed assets, determining how well the total volume of available fixed assets (machinery and equipment, buildings, structures, vehicles, resources invested in property improvement) corresponds to the scale of the business.
Average monthly output per employee (K19) is calculated as the quotient of dividing average monthly revenue by the average number of employees.
The working capital ratio (K14) is calculated by dividing the enterprise's current assets by average monthly revenue and characterizes the volume of current assets expressed in average monthly income, as well as their turnover. The indicator evaluates the circulation rate of funds invested in current assets. It is supplemented by working capital ratios in production and in calculations, the values of which characterize the structure of the enterprise’s current assets.
The working capital ratio (K14) is calculated by dividing the organization's current assets by average monthly revenue and characterizes the volume of current assets expressed in the organization's average monthly income, as well as their turnover.
The overall degree of solvency and the distribution of the indicator by type of debt represent the values of liabilities related to average monthly revenue and are indicators of turnover for the corresponding group of liabilities. In addition, these indicators determine the average time frame within which an enterprise can pay its creditors, provided that the average monthly revenue received in a given reporting period is maintained, if no current expenses are incurred, and all proceeds are used for settlements with creditors.
The overall degree of solvency and the distribution of the indicator by type of debt represent the values of obligations related to the average monthly revenue of the organization, and are indicators of turnover for the corresponding group of obligations of the organization. In addition, these indicators determine the average time frame within which an organization can pay its creditors, provided that the average monthly revenue received in a given reporting period is maintained, if no current expenses are incurred, and all proceeds are used for settlements with creditors.
The coefficient of working capital in production (K15) is calculated as the ratio of the cost of working capital in production to average monthly revenue.
The overall degree of solvency (K4) is determined as the quotient of dividing the amount of borrowed funds (liabilities) of the organization by average monthly revenue. The indicator characterizes the general situation with the solvency of the enterprise, the volume of its borrowed funds and the timing of possible debt repayment by creditors.
The degree of solvency for current obligations (K9) is defined as the ratio of the organization's current borrowed funds (short-term liabilities) to average monthly revenue.
What to do if the amounts in the declarations differ?
When checking the documentation, regulatory authorities may see that the revenue in the VAT declaration is greater than in the profit declaration. They believe that these amounts should always be identical, but in practice this is not the case. In theory, VAT revenue should be equal to profit, but this is not always true. The Federal Tax Service may request an explanation of the declaration, considering the error to be unfounded. Then the accountant needs to attach to the explanation documents that explain all transactions made during the current quarter. The more detailed he explains the current situation, the fewer questions there will be.
Tax revenue may be less in the case when some goods or services are not subject to VAT (detailed list of goods - Article 149 of the Tax Code of the Russian Federation).
But the opposite situation also exists. When might it occur? There are transactions subject to VAT that are not taken into account when calculating income tax. For example, the gratuitous transfer of goods. For clarity, let's look at an example.
A certain woman donated some goods worth 45,000 rubles (excluding VAT) for free use. Revenue amounted to 540,000 rubles for the first quarter. Then, in the VAT return, the accountant wrote the amount 540,000 + 45,000 = 585,000. This amount is less than revenue, but this situation can be explained. When transferred free of charge, VAT is charged on goods, as with a regular sale.
Thus, with different amounts for profit and VAT, it is necessary to show why this situation arose and write an explanation about this to the tax service.