Meaning
The study of the indicator value must be carried out over a period of at least three years.
It should be taken into account that, unlike many relative indicators, this coefficient can take a value below 0.
Such a case does not happen often in practice and is typical for companies with financing problems.
Regulatory
It is worth noting that the indicator in question is used only in the Russian practice of financial analysis. The meter was introduced in 1994, and the main purpose of use was to determine insolvency.
However, such a strict criterion is unattainable for many companies. In this context, it seems particularly relevant to analyze the indicator over time to identify its own trend of change.
If increased
An increase in the indicator is a positive signal for the overall financial stability and solvency of the company.
This positive trend is associated with many factors, some of them:
- with a reduction in the credit burden;
- with an increase in the share of equity capital;
- with improved solvency indicators;
- with an increase in the number of clients.
If it decreases
If the value of the indicator is significantly lower than the norm or has a negative trend, then we are talking about a decrease in the stability of the enterprise and an increase in dependence on credit resources.
This negative trend is reflected in the following aspects:
- reduction of equity capital;
- increasing the level of risk of loss of financial stability;
- increasing the level of risk of loan delinquency.
If negative
In practice, there are cases when the value of the indicator becomes less than 0.
The economic activity of such an enterprise is carried out only through borrowed sources, which indicates an unstable situation and can lead to bankruptcy.
Possible reasons for the change
Any fluctuations in a company's financial performance are associated with many factors.
So, the indicator can be influenced to a greater extent by:
- the level of dependence of the company on creditors;
- stage of the company's life cycle;
- market situation;
- belonging to the industry.
It is also necessary to take into account environmental factors that can, to one degree or another, influence the financial position of the company.
How to improve?
Improvement of the indicator can be achieved through:
- optimization of the structure of current assets and borrowed funds;
- directing net profit into the current activities of the company;
- attracting new funds from owners;
- reduction of the production cycle;
- increasing sales volume.
To determine the most effective direction of development for a particular company, a comprehensive analysis is required, which involves a multifactorial study.
Identifying problems and contradictions in the functioning of an object both within itself and in relation to the external environment allows you to respond to changes in a timely manner.
Thus, we can conclude that in conditions of high volatility in the macro environment, companies need continuous adaptation.
In this context, the use of the considered analytical tools makes it possible to timely identify negative trends.
How is the working capital ratio determined?
To conduct any type of financial analysis, access to special financial reporting forms is required.
In particular, to find the value of the coefficient in question, data from the company’s balance sheet is needed.
In this case, the determination of the indicator value is carried out in two stages:
- calculation of the amount of own working capital (SOS);
- coefficient calculation.
It is worth noting that the sum of SES can also be used as a separate analytical indicator.
General formula
The first step in calculating the indicator is determining the amount of SOS.
To do this, you need to transform the balance sheet data as follows:
- Owc – own working capital;
- Ac – current assets;
- Lc – short-term liabilities.
Then the general formula will take the following form:
Current assets
In modern financial terminology, there are a huge number of concepts and designations.
The peculiarities of the circulation time of such assets make it possible to also call them current or mobile. Regardless of the designation used, the indicator will be calculated using a general formula.
Working capital
Working capital is the monetary expression of all groups of the company's working capital in the aggregate.
Since components in monetary terms are used to calculate the coefficient under consideration, the general calculation formula can be reduced to the final form:
Material stocks
In some situations, companies may need more detailed financial analytics. In this case, an analysis is carried out in terms of types of current assets.
All data for the calculation, as in the previous case, are in the balance sheet.
The general formula is as follows:
where Inv is the monetary expression of inventories.
Balance calculation
For convenience and speed of information retrieval, we present the calculation components in the form of corresponding reporting lines.
Then the formulas will take the following form:
Calculation example
Let's consider the algorithm for determining the value of the coefficient using the example of conditional information from the balance sheet presented in the table.
Then the coefficients for providing own working capital will take the following values:
- For 2021 = (560 - 400)/560 = 0.3
- For 2021 = (530 - 420)/530 = 0.2
- For 2015 = (400 - 390)/400 = 0.02
For more detailed analytics, let’s imagine the inventory coverage ratio for the same time period:
- For 2021 = (560 - 400)/100 = 1.6
- For 2021 = (530 - 420)/110 = 1
- For 2015 = (400 - 390)/100 = 0.1
From the calculated indicators it is clear that throughout the entire period under review, a positive trend is observed.
The improvement in financial stability is primarily associated with a decrease in financing of current activities through short-term accounts payable.
There is also a trend toward improved inventory financing. As of 2021, the company provides the latter entirely from its own funds.
Examples of calculating the working capital ratio
If the coefficient is negative for the organization:
- no equity capital;
- The company's current assets are formed by borrowed funds, which indicates high debt from borrowers;
- the risk of the organization incurring debt on its obligations increases;
- there is a high probability of the company losing its financial stability.
The value of the standard indicator is a very strict criterion for Russian enterprises
For many organizations, this value is quite difficult to achieve.
Example 1.
It is necessary to calculate the value of the SOS coverage ratio at the beginning and end of the period.
Initial data:
- Capital and reserves: 250 million rubles at the beginning, 270 million rubles at the end of the period.
- Non-current assets: 140 million rubles at the beginning, 160 million rubles at the end of the period.
- Current assets: 240 million rubles at the beginning, 265 million rubles at the end of the period.
Value at the beginning of the period:
To security SOS = (250-140)/240 = 0.46 (corresponds to the standard value).
Ratio value at the end of the period:
To security SOS = (270-160)/265 = 0.4 (corresponds to the standard value).
Example 2.
Based on the results of the previous example, calculate the dynamics of the value of the SOS security ratio.
Dynamics of security SOS = 0.4/0.46 = 0.87
The value of the coefficient compared to the beginning of the period by the end of the year decreased by 13%.
It is necessary to pay attention to this indicator
- Firstly, its value is controlled at the legislative level.
- Secondly, a poor ratio is one of the signs of an organization's insolvency.
The indicator should be maintained at an acceptable level. Naturally, it is necessary to apply an effective strategy for managing the company's working capital.
Positive dynamics of the coefficient will attract more solvent counterparties
You should also monitor the value of this coefficient among counterparties important to the company.
An example of calculating the indicator of providing current assets with own funds:
Unit of measurement: thousand rubles.
| Balance | On 31 December 2016 | On 31 December 2015 |
| Assets | ||
| I. NON-CURRENT ASSETS | ||
| TOTAL FOR SECTION I | 669 | 670 |
| II. CURRENT ASSETS | ||
| TOTAL FOR SECTION II | 475 | 532 |
| Balance | 1144 | 1202 |
| Liabilities | ||
| III. OWN CAPITAL AND RESERVES | ||
| TOTAL FOR SECTION III | 744 | 645 |
| IV. LONG TERM DUTIES | ||
| TOTAL FOR SECTION IV | 100 | 100 |
| V. SHORT-TERM LIABILITIES | ||
| TOTAL FOR SECTION V | 300 | 457 |
| Balance | 1144 | 1202 |
Indicator of provision of current assets with own funds (2016) = (744-669) / 475 = 0.16
Indicator of provision of current assets with own funds (2015) = (645-670) / 532 = -0.05
Financial stability is growing, because the value of the indicator increased from -0.05 in 2015 to 0.16 in 2021. Throughout the entire period, the coefficient is above the norm and the company is able to finance 16% of all its current assets using its own capital. Dependence on debt capital is acceptable.
Own funds ratio – value
The equity ratio characterizes the availability of the enterprise's own working capital, which is necessary for its financial stability. Lack of own working capital, i.e. a negative value of the coefficient indicates that all the organization’s current assets and, possibly, part of the non-current assets were formed from borrowed sources.
Improving the financial position of an enterprise is impossible without effective working capital management, based on identifying significant factors and measures to provide the enterprise with its own working capital.
The standard value of the indicator Equity ratio – 0.1 (10%) – was established by Decree of the Government of the Russian Federation of May 20, 1994 No. 498 “On some measures to implement the legislation on insolvency (bankruptcy) of enterprises” as one of the criteria for determining an unsatisfactory structure balance sheet along with the current ratio.
The equity ratio is calculated to assess the company's solvency. If the equity ratio at the end of the reporting period is less than 0.1, then the structure of the company's balance sheet is considered unsatisfactory.
How to calculate K security?
Availability ratio of own sources of financing
The security ratio is calculated using the following formula:
K = (SCap - VAk) / OAk
Where:
- SKap is the company's own capital;
- VAk - non-current assets;
- OAK - current assets.
Let's look at the components of the formula in more detail.
Equity is the totality of a company's own sources of financing.
Non-current assets are the actual cost of the company's fixed assets and its other assets, the useful life of which exceeds 1 year.
Current assets are the actual cost of all current assets at the disposal of the enterprise. The useful life of current assets is less than one year.
The company operates normally when the indicator value is not lower than 0.1. A value of at least 0.5 is considered optimal. If the coefficient is close to 1, this means that the company fully meets its need for working capital from its own sources of financing, i.e. it is financially stable. If the indicator is below 0.1, then the organization exists on borrowed funds, its financial condition is critical.
Availability ratio of own sources of financing
Average statistical values by year for Russian enterprises
| Revenue amount | Values by year, rel. units | ||||||
| 2012 | 2013 | 2014 | 2015 | 2016 | 2017 | 2018 | |
| Microenterprises (revenue | -0.900 | -0.652 | -0.580 | -0.553 | -0.637 | -0.629 | -0.630 |
| Mini-enterprises (10 million rubles ≤ revenue | -0.566 | -0.310 | -0.338 | -0.324 | -0.318 | -0.366 | -0.396 |
| Small enterprises (RUB 120 million ≤ revenue | -0.372 | -0.207 | -0.335 | -0.268 | -0.251 | -0.239 | -0.228 |
| Medium-sized enterprises (RUB 800 million ≤ revenue | -0.255 | -0.263 | -0.226 | -0.197 | -0.217 | -0.166 | -0.216 |
| Large enterprises (revenue ≥ 2 billion rubles) | -0.191 | -0.278 | -0.370 | -0.400 | -0.387 | -0.411 | -0.429 |
| All organizations | -0.248 | -0.282 | -0.353 | -0.355 | -0.351 | -0.365 | -0.385 |
Table values are calculated based on Rosstat data
Debt to equity ratio
This ratio provides the most general assessment of financial stability. Shows how many units of borrowed funds account for each unit of equity:
Debt to Equity Ratio = Debt Capital / Equity Capital
Analyze the change in the value of the indicator over time. The growth of the indicator in dynamics indicates the increasing dependence of the enterprise on external investors and creditors. The recommended Kzc value of 0.7 signals that the financial stability of the enterprise is in doubt.
The higher the value of the indicator, the higher the risk level of investors, since in case of failure to fulfill payment obligations, the possibility of bankruptcy increases.
Financial stability ratios
One of the characteristics of a stable position of an enterprise is its financial stability.
The following financial stability coefficients characterize independence for each element of the enterprise’s assets and for property as a whole, making it possible to measure whether the company is financially stable enough.
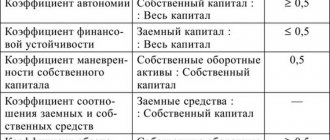
Autonomy coefficient
Financial dependency ratio
Debt to equity ratio
Maneuverability coefficient of own working capital
Ratio of mobile and immobilized assets
Working capital coverage ratio from own sources of financing
Own funds ratio
Inventory coverage ratio with own funds
Capital preservation ratio
The simplest financial stability ratios characterize the relationship between assets and liabilities as a whole, without taking into account their structure. The most important indicator of this group is the coefficient of autonomy (or financial independence, or concentration of equity capital in assets).
The stable financial position of an enterprise is the result of skillful management of the entire set of production and economic factors that determine the results of the enterprise.
Financial stability is determined both by the stability of the economic environment within which the enterprise operates, and by the results of its functioning, its active and effective response to changes in internal and external factors.
The main task of analyzing the financial stability of an enterprise is to assess the degree of independence from borrowed sources of financing. In the process of analysis, it is necessary to answer the questions: how independent is the company from a financial point of view, is the level of this independence increasing or decreasing, and whether the state of its assets and liabilities meets the objectives of its financial and economic activities.
In the classical theory of financial reporting analysis, financial stability is understood as such a ratio of assets and liabilities of an organization that guarantees a certain level of risk of insolvency of the organization.
Thus, as indicators of financial stability, coefficients characterizing the structure of assets and liabilities of the balance sheet, as well as the relationship between individual items of assets and liabilities ( relative indicators of financial stability)
).
Autonomy coefficient (financial independence, concentration of equity capital in assets)
Characterizes the independence of the enterprise from borrowed funds and shows the share of its own funds in the total cost of all funds of the enterprise. The higher the value of this coefficient, the more financially sound, stable and more independent the enterprise is from external creditors:
Autonomy (independence) coefficient = Own capital / Assets
Ka = (p. 490 + p. 640 + p. 650) / p. 700 form No. 1
or
Ka = page 490 / page 700
According to the form of the balance sheet since 2011, the formula has the form: Ka = line 1300 / line 1600
The normative generally accepted value of the indicator is considered to be a value of the autonomy coefficient greater than 0.5 but not more than 0.7. But it is necessary to take into account that the independence coefficient significantly depends on industry specifics (the ratio of non-current and current assets).
The higher the share of non-current assets of an enterprise (production requires a significant amount of fixed assets), the more long-term sources are needed to finance them, which means that the share of equity capital should be greater (the higher the autonomy coefficient).
Note that in international practice, the debt ratio (financial dependence coefficient) indicator is widespread, which is the opposite in meaning to the autonomy coefficient, but also characterizes the ratio of equity and borrowed capital.
A fairly high level of independence coefficient in the USA and European countries is considered to be 0.5-0.6. At the same time, the amount of liabilities does not exceed the amount of own funds, which provides creditors with an acceptable level of risk. In Asian countries (Japan, South Korea), a value of 0.3 is considered sufficient.
In the absence of justified standards, this indicator is assessed dynamically. A decreasing value indicates an increase in risk and a decrease in financial stability.
Moreover, with an increase in the share of liabilities, not only does the risk of non-repayment increase, in addition, interest expenses increase, and the company’s dependence on possible changes in interest rates increases.
Financial dependency ratio
Financial dependence coefficient, characterizing dependence on external sources of financing (i.e., what share in the entire capital structure is borrowed funds). The indicator is widely used in the West. The indicator is defined as the ratio of total debt (sum of short-term liabilities and long-term liabilities) and total assets.
Financial dependence ratio = Liabilities / Assets
In accordance with the Order of the Ministry of Regional Development of the Russian Federation dated April 17, 2010 No. 173, the financial dependence coefficient is determined by the formula:
Kfz = (D0 + KO - Zu + Dbp + R) / P
where, Kfz - coefficient of financial dependence; D0 - long-term liabilities; KO - short-term liabilities; Zu - debt to the founders; Dbp - deferred income; R - reserves for future expenses;
P - liabilities.
Kfz = (p. 590 + p. 690 - p. 630 - p. 640 - p. 650) / p. 700 f. No. 1
Kfz = (page 1400 + page 1500 - Zu - page 1530 - page 1540) / page 1700
Note that the line “Debt to participants (founders) for payment of income” (in the previous form - code 630) is excluded from the new form, since this debt is a payable and can be disclosed in the notes to the financial statements.
The recommended value of this coefficient should be less than 0.8. The optimal ratio is 0.5 (i.e. an equal ratio of equity and debt capital). If the indicator is less than 0.8, it means that liabilities should occupy less than 80% of the capital structure.
Debt to equity ratio
This ratio provides the most general assessment of financial stability. Shows how many units of borrowed funds account for each unit of equity:
Debt to Equity Ratio = Debt Capital / Equity Capital
Kzs = (p. 590 + p. 690 - p. 640 - p. 650) / (p. 490 + p. 640 + p. 650) form No. 1
or
Kzs = (p.590 + p.690) / p.490
Kzs = (page 1500 + page 1400) / page 1300
Analyze the change in the value of the indicator over time. The growth of the indicator in dynamics indicates the increasing dependence of the enterprise on external investors and creditors. The recommended Kzc value of 0.7 signals that the financial stability of the enterprise is in doubt.
The higher the value of the indicator, the higher the risk level of investors, since in case of failure to fulfill payment obligations, the possibility of bankruptcy increases.
Maneuverability coefficient of own working capital (equity capital agility coefficient)
This ratio shows how much of the company's own working capital is in circulation. The agility factor must be high enough to provide flexibility in the use of own funds:
Maneuverability coefficient of own working capital = Own working capital / Own capital
Km = (page 490 - page 190) / page 490 form No. 1
Km = (page 1300 - page 1100) / page 1300
A sharp increase in this ratio cannot indicate normal activity of the enterprise, because an increase in this indicator is possible either with an increase in own working capital, or with a decrease in own sources of financing. The recommended coefficient value is 0.2 – 0.5.
Ratio of mobile and immobilized assets
Shows how many non-current assets account for each ruble of current assets:
Ratio of mobile and immobilized assets = Current assets / Non-current assets
Km/i = (page 190 + page 230) / (page 290 - page 244 - page 252) form No. 1
or
Km/i = page 190 / page 290
Km/i = page 1100 / page 1200
No standard values have been established for this indicator.
Working capital coverage ratio from own sources of financing
The ratio shows whether the enterprise has its own funds necessary for its financial stability:
Working capital coverage ratio with own sources of financing = (Equity capital - Non-current assets) / Current assets
Ko = (p. 490 - p. 190)/(p. 290 - p. 230) form No. 1
Ko = (p. 1300 - p. 1100) / p. 1200
The methodological literature indicates that the enterprise is provided with its own sources of working capital financing with a coefficient value of ≥0.1.
Own funds ratio
The coefficient of provision with own working capital shows the sufficiency of the enterprise's own funds necessary to finance current (operating) activities, i.e. ensuring financial stability. This indicator was introduced normatively by the Order of the Federal Fund for Financial Affairs of August 12, 1994 No. 31-r, and is not widespread in Western practice of financial analysis.
The formula for calculating the working capital ratio is as follows:
Equity ratio = (Equity capital - Non-current assets) / Current assets
Xos = (p. 490 - p. 190) / p. 290 form No. 1
Xos = (p. 1300 - p. 1100) / p. 1200
According to the above order, the indicator is used as a sign of insolvency (bankruptcy) of the enterprise. The normal value of the equity ratio should be at least 0.1.
Inventory coverage ratio with own funds
The coefficient of provision of material inventories with own funds is an indicator characterizing the level of financing of inventories from the enterprise’s own sources (funds).
The formula for calculating the coefficient is:
Inventory coverage ratio with own funds = Own working capital / Inventories
Goats = (p. 490 + p. 590 - p. 190) / p. 210
Goats = (p. 1300 + p. 1400 - p. 1100) / p. 1210
In practice, there is a modified method for calculating this indicator; inventories are supplemented by costs (costs in construction in progress and advances to suppliers and contractors). In this case, the formula for calculating the ratio of supply of inventories and costs with own working capital will take the form:
Goats = (Equity + Long-term liabilities - Non-current assets) / (Inventories + Work in progress costs + Advances to suppliers and contractors)
The standard value of the coefficient lies in the range from 0.6 to 0.8, i.e. the formation of 60-80% of the enterprise's reserves should be carried out at its own expense. The higher the value of the indicator, the less dependence of the enterprise on borrowed capital in terms of the formation of reserves and, consequently, the higher the financial stability of the organization.
Capital preservation ratio
The indicator characterizes the dynamics of equity capital. The ratio is calculated as the ratio of equity at the end of the period to equity at the beginning of the period:
Equity retention ratio = Equity at the end of the period / Equity at the beginning of the period
Ksks = line 490 k.p. / page 490 n.p.
Ksks = line 1300 k.p. / page 1300 n.p.
The optimal coefficient value is greater than or equal to 1.
Note that, unlike other stability coefficients, this indicator is not structural, but dynamic, so it can correspond to the required value even if the financial situation generally deteriorates.
The rules for conducting financial analysis by an arbitration manager, indicated above in the list of standard methods for analyzing financial condition, also require calculating indicators such as:
- share of overdue accounts payable in liabilities;
- the ratio of accounts receivable to total assets.
Moreover, the accounts receivable account takes into account not only short-term and long-term accounts receivable on the balance sheet, but also “potential current assets for return,” which mean: the amount of accounts receivable written off at a loss and the amount of guarantees and sureties issued. Information about these “assets” is disclosed in a certificate attached to the balance sheet about the presence of assets recorded in off-balance sheet accounts. It is assumed that if the combination of obligations is favorable for the organization, these amounts can be received by it and used to pay off obligations.
An analysis of the stability of the financial condition as of a particular date makes it possible to find out how correctly the enterprise managed financial resources during the period preceding this date.
It is important that the state of financial resources meets the requirements of the market and meets the development needs of the enterprise, since insufficient financial stability can lead to the insolvency of the enterprise and a lack of funds for the development of production, and excess financial stability can hinder development, burdening the enterprise’s costs with excess inventories and reserves. Thus, the essence of financial sustainability is determined by the effective formation, distribution and use of financial resources.
The financial position of an enterprise is considered stable if it covers with its own funds at least half of the financial resources necessary for normal business activities, effectively uses financial resources, maintains financial, credit and accounting discipline, in other words, is solvent.
The financial position is determined based on an analysis of liquidity and solvency, as well as an assessment of financial stability. Analysis of the financial stability of a company is carried out both by the coefficient method and by analyzing the net assets indicator and by analyzing absolute indicators.
Source: https://afdanalyse.ru/publ/finansovyj_analiz/fin_koefitcienti/analiz_finansovoj_ustojchivosti/3-1-0-22
Why is it necessary to calculate KOSOS?
The value of the coefficient is of interest to economists and business managers. It will provide answers to the following questions:
- Is there a shortage of working capital?
- Is leverage dragging down your business?
- Does the company have its own funds to support its activities?
- Is everything in order with the company's solvency?
- Is the balance sheet structure satisfactory?
- Is there a danger of bankruptcy in the foreseeable future?
- Is working capital management effective?
- Will the company be able to operate if problems arise with attracting loans and borrowings?
Regular analysis of the ratio over time allows you to identify possible problems with liquidity, solvency and financial stability and take timely measures to improve the situation.
Standard
The regulatory significance for domestic enterprises is clearly stipulated by law. Therefore, it is necessary to find the working capital ratio to monitor the company’s performance. Its value is normally above 0.1.
If during the analysis it was determined that the company has a negative value for this indicator, it means that there are a number of negative trends. The first of these is the lack of own funds. If they exist, but the result is still negative, therefore, the debt to creditors is high.
This is interesting: Collector ru personal account
This situation indicates a loss of financial stability and a decline in the investment rating. Therefore, even if this standard is difficult to achieve, the working capital ratio must be at the required level.
Examples of coefficient calculation
An example of calculating a forecast for changes in the solvency of an enterprise
A toy shop
Own capital = 500,000 rub. This includes the owner's investments and income from trading operations.
Non-current assets = 300,000 rub. This includes the cost of display cases, cash registers, and other retail equipment.
Current assets = 250,000 rub. They consist of goods located in the store and warehouse, and cash balances in the cash register.
K = (500,000 - 300,000)/250,000 = 0.8
0,5
Web design studio
Own capital = 120,000 rubles. This includes investments from owners and income from completed orders.
Non-current assets = 90,000 rub. This includes the cost of computers and related equipment.
Current assets = 450,000 rub. This includes receivables for completed orders and funds in the company's current account.
K =0)/450,000 = 0.066
TO
Repair team
Own capital = 1,100,000 rub. It includes investments by owners and income from work performed. Non-current assets = RUB 900,000. This includes repair equipment, special clothing, and a vehicle, which is included in the cost of the brigade. Current assets = 680,000 rub. These include construction materials and consumables for repair equipment.
K = (1,100,000 - 900,000)/680,000 = 0.29
0,1
Freight transport company
Own capital = 3,100,000 rub. It includes shareholder investments.
Non-current assets = 2,000,000 rubles. This includes the cost of two trucks and repair equipment.
Current assets = 900,000 rub. They include gasoline, consumables, and funds at the organization’s cash desk.
K = (3,100,000 - 2,000,000)/900,000 = 1.22
In this case, K exceeds 1. Accordingly, the company has a sufficient amount of its own funds to ensure operating activities even under the most negative circumstances. The organization does not need borrowed money or any other financial assistance.
Funding ratio
To fully assess the financial stability of a company, you need to use not only the considered indicator, but also other financial indicators. sustainability, in particular, the coefficients of autonomy (the solvency of the company) and the efficiency of using its own funds.
The security ratio is very important for assessing business prospects!
Calculation example
To better understand the principle of analyzing your own resources in circulation, it is necessary to consider the calculation using an example.
The provision of own working capital is determined according to the balance sheet at the end of the operating period.
For example, this year an enterprise’s equity capital increased from 260 to 280 thousand rubles. Non-current assets also increased from 150 to 170 thousand rubles, and current assets - from 250 to 275 thousand rubles. The coefficient at the beginning of the period is equal to:
At the end of the reporting period the indicator was:
We can come to the conclusion that the supply ratio in the period under study complied with the standard. This indicates good financial stability of the company.
Example No. 2
Let's calculate the ratio of assets' own funds based on other data.
Non-current assets (1st section BO-1 – page 1100) – 98,600 thousand rubles.
Working capital (2nd section BO-1 – page 1200) – 15,800 thousand rubles.
Capital/reserves (3rd section BO-1 – page 1300) – 100,000 thousand rubles.
K sos = (100 00 – 98 600) / 15 800 = 0.09
After analyzing the obtained value, the company economist informs management and provides the corresponding conclusions:
• the coefficient value is below the critical level by 0.01 (0.09 – .01 = – 0.01);
• the equity ratio of 0.09 shows the negligible amount of equity capital in the organization’s assets – 9%;
• such provision with own funds indicates a critical situation in the company - unsatisfactory balance sheet structure, financial instability, insolvency towards partners and creditors.
In conclusion, we note that it is necessary to analyze the financial condition of an enterprise on the basis of values calculated using such an indicator as the equity ratio. The calculation formula is simple, but the correct interpretation of the obtained values will help to take timely measures to eliminate the crisis situation.
Economic meaning of the coefficient
Non-current assets of the enterprise are characterized by low liquidity. They are more difficult and take longer to exchange for other material goods. Therefore, they must be covered by a highly liquid source - equity capital. However, part of the capital must remain to finance current activities. In this case, the enterprise is guaranteed to be able to function normally and will be considered financially stable.
Reference! Non-current assets include buildings, structures, land, investments in subsidiaries and affiliates, loans for a period of more than 1 year, expenses for business reputation, rights and patents, property leased or rented.
How to calculate the coverage ratio of non-current assets with equity capital?
The coefficient of provision (or coverage) with own working capital reflects the share of own working capital in all current assets of the enterprise.
Using it, you can determine whether a given enterprise is capable of financing current activities only with its own working capital. The ratio of own working capital is defined as the ratio of the difference between the equity capital and non-current assets of an enterprise to its current assets:
Kosos = (SK – VA) / OA
All data necessary for the calculation is contained in the enterprise’s balance sheet. For the balance lines, the formula will be as follows:
Kosos = (p. 1300 – p. 1100) / p. 1200
For information on the balance sheet, articles and sections, see the material “Balance Sheet (assets and liabilities, sections, types).”
The meaning of the coefficient is that non-current assets, which are low-liquid, must be fully covered by a stable source of funds - equity capital. At the same time, some part of the capital must remain to finance the enterprise’s current activities.
For information on the liquidity of the balance sheet and its items, see the material “Analysis of Balance Sheet Liquidity.”
Average statistical values by year for Russian enterprises
| Revenue amount | Values by year, rel. units | ||||||
| 2012 | 2013 | 2014 | 2015 | 2016 | 2017 | 2018 | |
| Microenterprises (revenue | -0.900 | -0.652 | -0.580 | -0.553 | -0.637 | -0.629 | -0.630 |
| Mini-enterprises (10 million rubles ≤ revenue | -0.566 | -0.310 | -0.338 | -0.324 | -0.318 | -0.366 | -0.396 |
| Small enterprises (RUB 120 million ≤ revenue | -0.372 | -0.207 | -0.335 | -0.268 | -0.251 | -0.239 | -0.228 |
| Medium-sized enterprises (RUB 800 million ≤ revenue | -0.255 | -0.263 | -0.226 | -0.197 | -0.217 | -0.166 | -0.216 |
| Large enterprises (revenue ≥ 2 billion rubles) | -0.191 | -0.278 | -0.370 | -0.400 | -0.387 | -0.411 | -0.429 |
| All organizations | -0.248 | -0.282 | -0.353 | -0.355 | -0.351 | -0.365 | -0.385 |
Table values are calculated based on Rosstat data
Tags: asset, balance sheet, accountant, capital, ratio, credit, problems, expense, formula